
Apache ECharts
Highly customizable and interactive charts ready for big datasets.
- Active
- Apache-2.0
- TypeScript
- JavaScript charting libraries
- GitHub stars
- 67.7K#6 in the directory
- npm downloads / week
- 10.7M
- Commits, last 12 months
- 242
- Contributors
- 274
- Last commit
- Latest release
- 6.1.0May 19, 2026
Overview
Apache ECharts is an open-source JavaScript charting library released under the Apache-2.0 license. Its GitHub repository has 67,746 stars, 19,942 forks, and 274 contributors. It is actively developed with 242 commits in the last 12 months. The latest release, 6.1.0, was published on May 19, 2026. On npm it is downloaded about 10.7M times per week.
Its GitHub description: Apache ECharts is a powerful, interactive charting and data visualization library for browser
GitHub topics: echartsdata-visualizationchartscharting-libraryvisualizationapachedata-vizcanvassvg
Try it live
This demo of Apache ECharts draws the same Gapminder dataset (life expectancy, GDP per capita and population for 142 countries, 1952–2007) in the same three views as the other libraries’ demos, so you can compare them side by side; it runs on Cloudish and may take a few seconds to wake up.
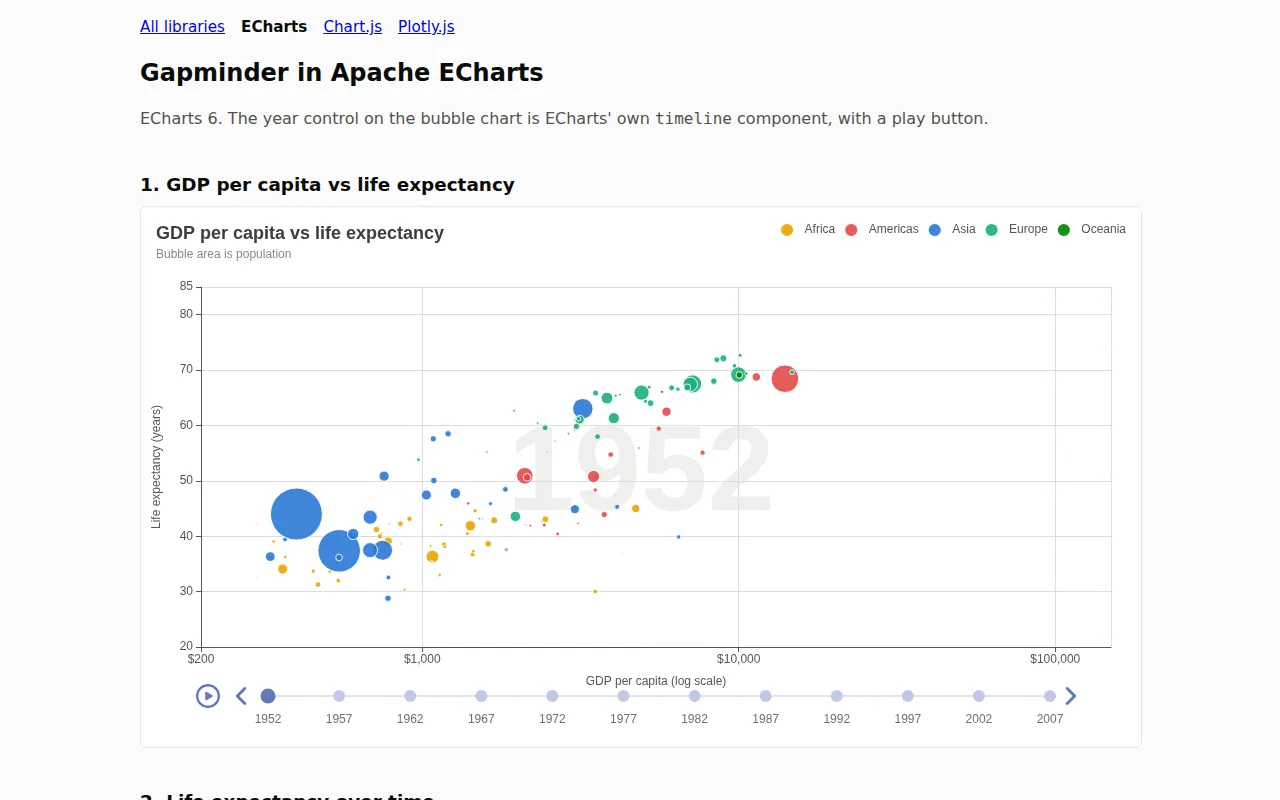
Views: GDP per capita vs life expectancy by year, life expectancy over time for one country, and a world map of one metric for one year.
The same demo in other libraries: Chart.js · Plotly.js · Matplotlib · Shiny for R · Streamlit. See them all side by side.
Install
Development activity
Commits per month to the default branch over the last 12 complete months.
Show data as a table
| Month | Commits |
|---|---|
| Nov 2025 | 22 |
| Dec 2025 | 42 |
| Jan 2026 | 21 |
| Feb 2026 | 15 |
| Mar 2026 | 45 |
| Apr 2026 | 39 |
| May 2026 | 34 |
| Jun 2026 | 1 |
| Jul 2026 | 8 |
| Aug 2026 | 2 |
| Sep 2026 | 11 |
| Oct 2026 | 2 |
Popularity among JavaScript charting libraries
Show data as a table
| Tool | Stars |
|---|---|
| Chart.js | 67,803 |
| Apache ECharts | 67,746 |
| Plotly.js | 18,384 |
| ApexCharts | 15,192 |
| Frappe Charts | 15,102 |
| Chartist.js | 13,469 |
| G2 | 12,667 |
Alternatives to Apache ECharts
-
 Chart.js
Charts with the canvas tag.
-
 Plotly.js
Powerful declarative library with support for 20 chart types.
-
 ApexCharts
Modern & Interactive SVG Charts.
-
 Frappe Charts
Simple, responsive SVG charts with zero dependencies.
-
 Chartist.js
Responsive charts with great browser compatibility.
-
 G2
An interactive and responsive charting library based on the grammar of graphics, maintained by Alibaba.
More comparisons: Chart.js vs Apache ECharts · Apache ECharts vs Plotly.js · ApexCharts vs Apache ECharts · Apache ECharts vs Frappe Charts · D3.js vs Apache ECharts · Apache ECharts vs Lightweight Charts
Apache ECharts FAQ
Is Apache ECharts open source?
Is Apache ECharts still maintained?
How do I install Apache ECharts?
npm install echarts.What are the best alternatives to Apache ECharts?
What language is Apache ECharts written in?
Data: GitHub API, npm. Updated Nov 18, 2026.